
Analysis of Blocking Probability for different Coverage Conditions
In this notebook, we compute the
blocking probabilityas a function ofAL probability distribution of UEs.One can find how ALs are distributed in a CORESET by performing PDCCH link level performance with different ALs or system level simulations to determine SINR distribution of UEs.
In fact, suitable ALs are used for UEs to meet suitable PDCCH performance requirements. ____________________________________________________________________________________________________________________
We consider 3 scenarios corresponding to
Good,MediumandPoorcoverage for evaluation.Good Coverage : Most of the UEs are in good coverage and require low ALs (i.e., ALs 1 and 2), with AL distribution [0.5, 0.4, 0.07, 0.02, 0.01]
Medium Coverage : Most of the UEs are in medium coverage and require medium ALs (i.e., AL 4), with AL distribution [0.05, 0.2, 0.5, 0.2, 0.05]
Extreme Coverage : Most of the UEs are in poor coverage and require high ALs (i.e., ALs 8 and 16), with AL distribution [0.01, 0.02, 0.07, 0.4, 0.5]
The CORESET size
Nccepis 54 CCEs for this simulation.
Import Python Libraries
[1]:
import os
os.environ["CUDA_VISIBLE_DEVICES"] = "-1"
os.environ['TF_CPP_MIN_LOG_LEVEL'] = '3'

# %matplotlib widget
import matplotlib.pyplot  as plt
import matplotlib.patches as mpatches
import matplotlib as mpl

import numpy      as np
Import 5G Toolkit Libraries
[2]:
import sys
sys.path.append("../../")
from toolkit5G.Scheduler import PDCCHScheduler
Simulation Parameters
The following parameters are used for this simulation: - coresetID denotes the coreset ID. - slotNumber denotes the slot-number carrying the PDCCH. - searchSpaceType denotes the search space type. UE specific search space (USS) or Common search space (CSS). - nci denotes the variable corresponding to carrier aggregation. Current simulation does not assume carrier aggregation.
[3]:
mu                = np.random.randint(4)    # numerlogy for sub-carrier spacing
numSlotsPerFrame  = 2**mu * 10              # number of slots per radio frame
coresetID         = 1                       # coreset ID
slotNumber        = 0
searchSpaceType   = "USS"                   # search space type. UE specific search space
nci               = 0                       # variable corresponding to carrier aggregation
PDCCH Scheduling Parameters
Following parameters are crucial for PDCCH scheduling performance: - Nccep denotes coreset size or number of CCEs available for scheduling UEs. - strategy denotes the scheduling strategy. - numCandidates denotes number of PDCCH candidates per each Aggregation Level.
[4]:
Nccep             = 54
maxNumUEs         = 40
numUEs            = np.arange(0,maxNumUEs+1,4)
numUEs[0]         = 1
numIterations     = 1000
numCandidates     = np.array([6,6,4,2,1], dtype=int)
strategy          = "Conservative"
pdcchSchedulerObj = PDCCHScheduler(mu,slotNumber, coresetID, nci)
PDCCH Scheduling for Good Coverage Scenarios
The characteristics of good coverage is parameterized by
aggLevelProbDistributionForGoodCoverage.Simulation outcome (blockage probability) parameterized by
probOfBlockingForGoodCoverage.Scenario where the SNR/SINR is good enough, so that a
lowerAL (i.e., AL of 1 and 2) is choosen by the scheduler.
[5]:
################
# Good Coverage
################
aggLevelProbDistributionForGoodCoverage = np.array([0.5, 0.4, 0.07, 0.02, 0.01])
probOfBlockingForGoodCoverage = np.zeros(numUEs.shape)

for n in range(numUEs.size):
    print("Simulating (n,numUEs) : "+str(n)+", "+str(numUEs[n]))
    prob      = 0
    for i in range(numIterations):
        ueALdistribution  = np.random.multinomial(numUEs[n], aggLevelProbDistributionForGoodCoverage)
        rnti              = np.random.choice( np.arange(1,65519+1), size = (numUEs[n],), replace=False)
        count             = pdcchSchedulerObj(Nccep,searchSpaceType,ueALdistribution,numCandidates,rnti,strategy)[0]
        numBlockedUEs     = np.sum(count)
        prob              = prob + numBlockedUEs/numUEs[n]
    probOfBlockingForGoodCoverage[n] = prob/numIterations
Simulating (n,numUEs) : 0, 1
Simulating (n,numUEs) : 1, 4
Simulating (n,numUEs) : 2, 8
Simulating (n,numUEs) : 3, 12
Simulating (n,numUEs) : 4, 16
Simulating (n,numUEs) : 5, 20
Simulating (n,numUEs) : 6, 24
Simulating (n,numUEs) : 7, 28
Simulating (n,numUEs) : 8, 32
Simulating (n,numUEs) : 9, 36
Simulating (n,numUEs) : 10, 40
PDCCH Scheduling for Medium Coverage Scenarios
The characteristics of medium coverage is parameterized by
aggLevelProbDistributionForMediumCoverage.Simulation outcome (blockage probability) parameterized by
probOfBlockingForMediumCoverage.Scenario where the SNR/SINR is not good enough or medium, so that a
mediumAL (i.e., AL of 4) is choosen by the scheduler.
[6]:
##################
# Medium Coverage
##################
aggLevelProbDistributionForMediumCoverage = np.array([0.05, 0.2, 0.5, 0.2, 0.05])
probOfBlockingForMediumCoverage = np.zeros(numUEs.shape)

for n in range(numUEs.size):
    print("Simulating (n,numUEs) : "+str(n)+", "+str(numUEs[n]))
    prob      = 0
    for i in range(numIterations):
        ueALdistribution  = np.random.multinomial(numUEs[n], aggLevelProbDistributionForMediumCoverage)
        rnti              = np.random.choice( np.arange(1,65519+1), size = (numUEs[n],), replace=False)
        count             = pdcchSchedulerObj(Nccep,searchSpaceType,ueALdistribution,numCandidates,rnti,strategy)[0]
        numBlockedUEs     = np.sum(count)
        prob              = prob + numBlockedUEs/numUEs[n]
    probOfBlockingForMediumCoverage[n] = prob/numIterations
Simulating (n,numUEs) : 0, 1
Simulating (n,numUEs) : 1, 4
Simulating (n,numUEs) : 2, 8
Simulating (n,numUEs) : 3, 12
Simulating (n,numUEs) : 4, 16
Simulating (n,numUEs) : 5, 20
Simulating (n,numUEs) : 6, 24
Simulating (n,numUEs) : 7, 28
Simulating (n,numUEs) : 8, 32
Simulating (n,numUEs) : 9, 36
Simulating (n,numUEs) : 10, 40
PDCCH Scheduling for Extreme Coverage Scenarios
The characteristics of extreme coverage is parameterized by
aggLevelProbDistributionForExtremeCoverage.Simulation outcome (blockage probability) parameterized by
probOfBlockingForExtremeCoverage.Scenario where the SNR/SINR is extreme or poor, so that a higher AL (i.e., AL of 8 and 16) is choosen by the scheduler.
[7]:
################
# Extreme Coverage
################
aggLevelProbDistributionForExtremeCoverage = np.array([0.01, 0.02, 0.07, 0.4, 0.5])
probOfBlockingForExtremeCoverage = np.zeros(numUEs.shape)

for n in range(numUEs.size):
    print("Simulating (n,numUEs) : "+str(n)+", "+str(numUEs[n]))
    prob      = 0
    for i in range(numIterations):
        ueALdistribution  = np.random.multinomial(numUEs[n], aggLevelProbDistributionForExtremeCoverage)
        rnti              = np.random.choice( np.arange(1,65519+1), size = (numUEs[n],), replace=False)
        count             = pdcchSchedulerObj(Nccep,searchSpaceType,ueALdistribution,numCandidates,rnti,strategy)[0]
        numBlockedUEs     = np.sum(count)
        prob              = prob + numBlockedUEs/numUEs[n]
    probOfBlockingForExtremeCoverage[n] = prob/numIterations
Simulating (n,numUEs) : 0, 1
Simulating (n,numUEs) : 1, 4
Simulating (n,numUEs) : 2, 8
Simulating (n,numUEs) : 3, 12
Simulating (n,numUEs) : 4, 16
Simulating (n,numUEs) : 5, 20
Simulating (n,numUEs) : 6, 24
Simulating (n,numUEs) : 7, 28
Simulating (n,numUEs) : 8, 32
Simulating (n,numUEs) : 9, 36
Simulating (n,numUEs) : 10, 40
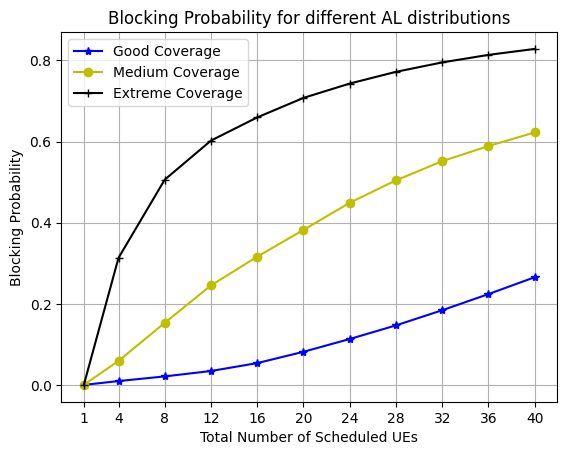
Plotting the results
The following results clearly demonstrates the improvement in blocking probability with improvement in coverage. - For 10 UEs, Medium coverage and Good coverage experiences ~25%, 70% improvement in performance in comparison to Extreme coverage. - For 20 UEs, Medium coverage and Good coverage experiences ~25%, 60% improvement in performance in comparison to Extreme coverage. - For 40 UEs, Medium coverage and Good coverage experiences ~40%, 45% improvement in performance in comparison to Extreme coverage.
Its the recreation of Fig. 8. Blocking probability for different AL distributions. from the paper referenced below.
[8]:
fig, ax = plt.subplots()
ax.plot(numUEs, probOfBlockingForGoodCoverage,    marker  = "*", linestyle = "solid", ms = 6, c = 'b', label = "Good Coverage")
ax.plot(numUEs, probOfBlockingForMediumCoverage,  marker  = "o", linestyle = "solid", ms = 6, c = 'y', label = "Medium Coverage")
ax.plot(numUEs, probOfBlockingForExtremeCoverage, marker  = "+", linestyle = "solid", ms = 6, c = 'k', label = "Extreme Coverage")

ax.legend()
ax.set_xlabel('Total Number of Scheduled UEs')
ax.set_ylabel('Blocking Probability')
ax.set_title('Blocking Probability for different AL distributions', fontsize=12)
ax.set_xticks(numUEs)
ax.grid()
plt.show()
References
[1] Blocking Probability Analysis for 5G New Radio (NR) Physical Downlink Control Channel. Mohammad Mozaffari, Y.-P. Eric Wang, and Kittipong Kittichokechai
[ ]: