
5. UE_Side: Carrier frequency offset (CFO) estimation and correction in 5G networks
The air interface of 5G NR is based on orthogonal frequency division multiplexing (OFDM), which divides the wideband carrier into small orthogonal subcarriers. Unlike the wideband signal, these subcarriers experience flat fading, resulting in significantly reduced receiver complexity and improved spectral efficiency. However, OFDM is very sensitive to time and frequency synchronization errors. These errors can arise in the frequency or time domains due to carrier frequency offset (CFO) and symbol time offset (STO), respectively. This experiment will focus on the carrier frequency offset and its impact on the system, as well as algorithms to estimate and correct the CFO using the synchronization signal block (SSB).
5.2 Import Libraries
5.2 Import Python and SDR Libraries
[1]:
# %matplotlib widget

import os
os.environ["CUDA_VISIBLE_DEVICES"] = "-1"
os.environ['TF_CPP_MIN_LOG_LEVEL'] = '3'

import numpy as np
import tensorflow as tf
import sionna as sn
import adi
import matplotlib.pyplot as plt

import matplotlib.patches as patches
import matplotlib.animation as animation
5.2 Toolkit Libraries
[2]:
import sys
sys.path.append("../../../../")

from toolkit5G.SequenceGeneration import PSS, SSS, DMRS
from toolkit5G.PhysicalChannels   import PBCH, PBCHDecoder
from toolkit5G.ResourceMapping    import SSB_Grid, ResourceMapperSSB
from toolkit5G.OFDM               import OFDMModulator
from toolkit5G.MIMOProcessing     import AnalogBeamforming
from toolkit5G.Configurations     import TimeFrequency5GParameters, GenerateValidSSBParameters
from toolkit5G.OFDM               import OFDMDemodulator
from toolkit5G.ReceiverAlgorithms import PSSDetection, SSSDetection, ChannelEstimationAndEqualizationPBCH, DMRSParameterDetection, CarrierFrequencyOffsetEstimation
from toolkit5G.Configurations     import TimeFrequency5GParameters

from toolkit5G.SequenceGeneration import PSS, SSS, DMRS
5.2 Simulation Parameters
[3]:
# System Parameters
center_frequency    = 1e9     # Carrier frequency for signal transmission

# OFDM Parameters
Bandwidth           = 5*10**6 # bandwidth
fftSize             = 1024    # FFT-size for OFDM
subcarrier_spacing  = 15000   # Subcarrier spacing
numOFDMSymbols      = 14      # Number of OFDM symbols considered for emulation | 1 slot
sample_rate         = fftSize*subcarrier_spacing # sample rate required by OFDM and DAC/ADC of SDR

# Pulse Shaping
numSamplesPerSymbol = 1

# number of samples returned per call to rx()
buffer_size         = int(4*fftSize*1.2*numSamplesPerSymbol*numOFDMSymbols)
5.2 TimeFrequency Parameters
[4]:
nSymbolFrame= 140*int(subcarrier_spacing/15000);   # Number of OFDM symbols per frame (Its a function of subcarrier spacing)

## This class fetches valid set of 5G parameters for the system configurations
tfParams    = TimeFrequency5GParameters(Bandwidth, subcarrier_spacing, fftsize = fftSize)
tfParams(nSymbolFrame, typeCP = "normal")
nRB         = tfParams.numRBs        # SSB Grid size (Number of RBs considered for SSB transition)
Neff        = tfParams.Neff          # Number of resource blocks for Resource Grid ( exclude gaurd band | offsets : BWP)
fftsize     = tfParams.fftsize       # FFT-size for OFDM
lengthCP    = tfParams.lengthCP      # CP length
nssbCandidatesInHrf = 4
5.2 SDR Setup
[5]:
# SDR setup
sdr             = adi.Pluto("ip:192.168.2.1")       # Create object of SDR setup object and configure the IP of SDR connect to the system
sdr.sample_rate = int(sample_rate)                  # Sets the sample rate for the ADC/DAC of the SDR.

# Config Rx
sdr.rx_lo                   = int(center_frequency) # Sets the receiver local oscillator frequency.
# For Pluto SDR, rx_lo can take a value between 325 MHz to 3.8 GHz.
sdr.rx_rf_bandwidth         = int(60*10**6)         # Set the bandwidth (in Hz) of the reception filter
# For Pluto SDR, tx_rf_bandwidth should be between 200 kHz and 56 MHz.
sdr.rx_buffer_size          = int(buffer_size)      # Number of samples to read and load into SDR buffer.
# The upper limit on the size of this buffer is defined by the DRAM size.

sdr.gain_control_mode_chan0 = 'slow_attack'              # Defines the mode of receiver AGC.
# # AGC modes:
#     # 1. "manual"
#     # 2. "slow_attack"
#     # 3. "fast_attack"
# The receive gain on the Pluto has a range from 0 to 74.5 dB.

# sdr.rx_hardwaregain_chan0   = 40.0 # dB, increase to increase the receive gain, but be careful not to saturate the ADC
# Sets the amplification gain (dB) provided by the low noise amplifier (LNA).
# Relevant only when `gain_control_mode_chan0` is "manual".
5.2 Receiver
5.2 Receive Samples from SDR
[6]:
# Clear buffer just to be safe
for i in range (0, 10):
    raw_data = sdr.rx()
# Receive samples
rx_samples = sdr.rx()
5.2 Time Synchronization: Coarse Tuning
[7]:
## PSS Detection: Based on time domain PSS Correlation
numofGuardCarriers = (int((tfParams.fftsize - Neff)/2), int((tfParams.fftsize + Neff)/2))
offsetToPointA = 0
firstSCIndex = int(numofGuardCarriers[0] + offsetToPointA)
## PSS Detection: Based on time domain PSS Correlation
# pssDetection = PSSDetection("correlation", "threshold")
pssDetection = PSSDetection("largestPeak")
ssboffset = int(numofGuardCarriers[0]+offsetToPointA)
pssPeakIndices, pssCorrelation, rN_ID2, freqOffset = pssDetection(rx_samples, fftSize, lengthCP = lengthCP[1],
nID2 = None, freqOffset = ssboffset)
## PSS Detection Plot
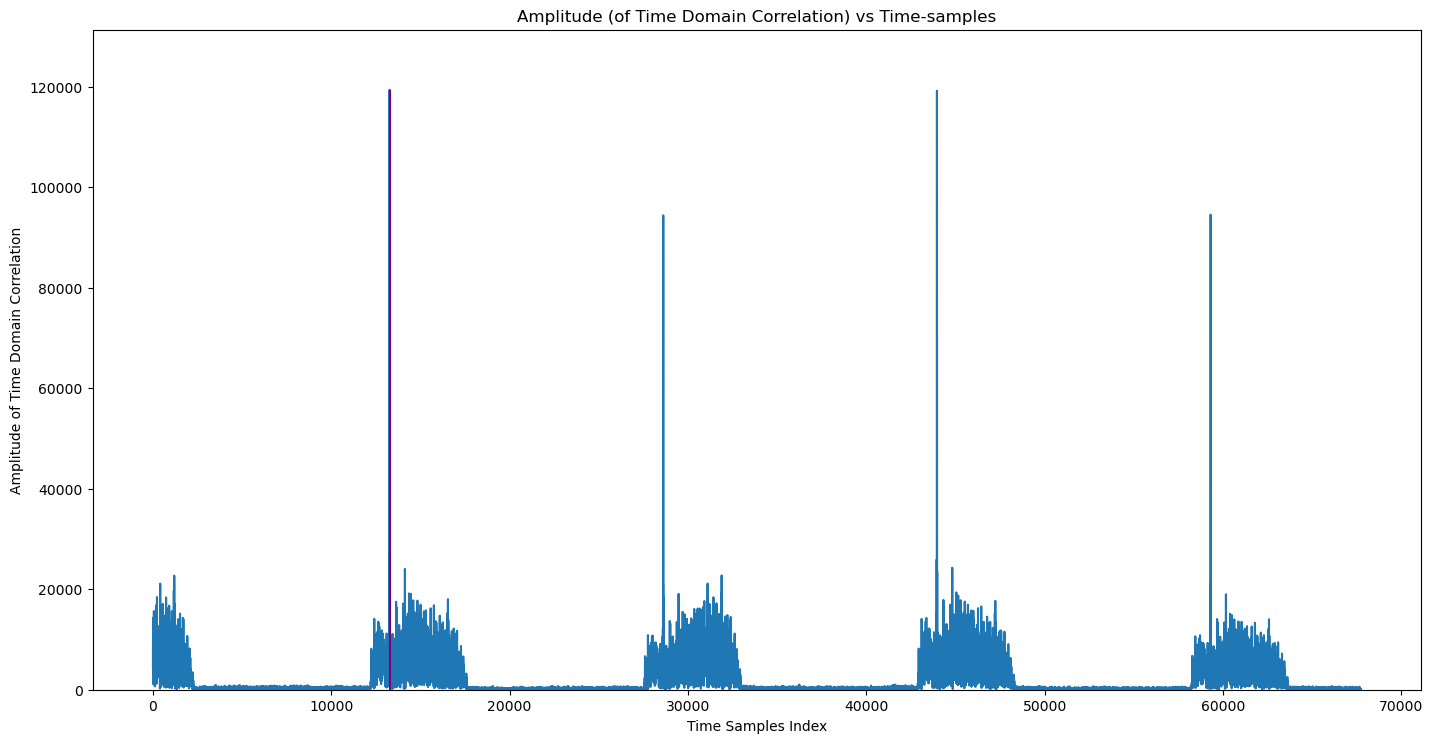
#################################################################
scaleFig = 1.75
fig, ax = plt.subplots(figsize=(30/scaleFig, 15/scaleFig))
# single line
ax.plot(pssCorrelation)
ax.vlines(x = pssPeakIndices, ymin = 0*pssCorrelation[pssPeakIndices],
ymax = pssCorrelation[pssPeakIndices], colors = 'purple')
ax.set_ylim([0,np.max(pssCorrelation)*1.1])
ax.set_xlabel("Time Samples Index")
ax.set_ylabel("Amplitude of Time Domain Correlation")
ax.set_title("Amplitude (of Time Domain Correlation) vs Time-samples")
plt.show()
**(rasterOffset, PSS-ID) (362, 0)
**(rasterOffset, PSS-ID) (362, 1)
**(rasterOffset, PSS-ID) (362, 2)
5.2 CFO Estimation
[8]:
## Parameters for computing CFO
cyclic_prefix_length      = lengthCP[1]    # Length of cyclic prefix
numSamples                = fftSize + cyclic_prefix_length   # OFDM samples of 1 symbol
firstIndex                = pssPeakIndices   # PSS detection
pssOfdmSymbols            = rx_samples[firstIndex: firstIndex + numSamples] # PSS samples

obj    = CarrierFrequencyOffsetEstimation(fftSize,cyclic_prefix_length)
cfoEst = obj(pssOfdmSymbols,numCFOIteration = 2)  # Computed CFO
5.2 OFDM Demodulation
[9]:
## OFDM Demodulator Object
ofdmDemodulator = OFDMDemodulator(fftSize, lengthCP[1])
pssStartIndex   = pssPeakIndices
indices         = np.arange(rx_samples.size)

# With CFO correction
cfo             = cfoEst
rxGrid          = ofdmDemodulator(((np.exp(-1j*cfo*indices/fftSize)*rx_samples).reshape(1,-1))[...,pssStartIndex:(pssStartIndex+4*(fftSize+lengthCP[1]))])
ssbEstimate     = rxGrid[:,:,ssboffset:(ssboffset+240)]

# Plot Received Resource Grid
fig, ax = plt.subplots()
plt.imshow(np.abs(rxGrid[0]), cmap = 'hot', interpolation='nearest', aspect = "auto")
ax = plt.gca();
ax.grid(color='c', linestyle='-', linewidth=1)
plt.show()
print("The Estimated CFO is " +str(cfo))
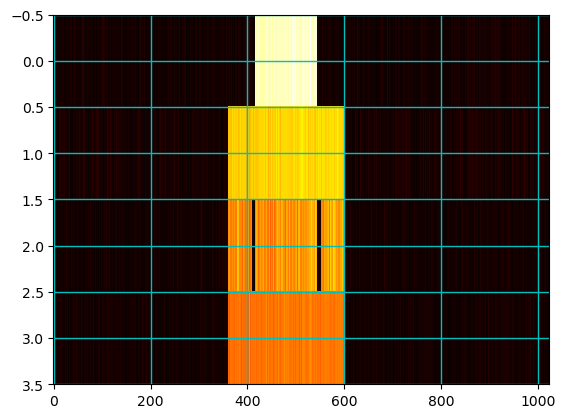
The Estimated CFO is -1.7413802607132152
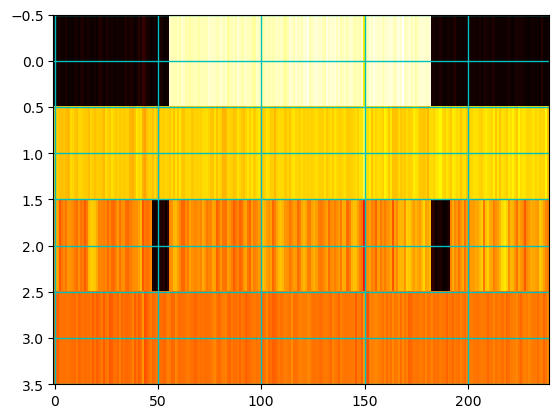
5.2 Extract SSB Grid
[10]:
## Plot SSB
fig, ax = plt.subplots()
plt.imshow(np.abs(ssbEstimate[0]), cmap = 'hot', interpolation='nearest', aspect = "auto")
ax = plt.gca();
ax.grid(color='c', linestyle='-', linewidth=1)
plt.show()
5.2 PBCH Processing
SSS Detection
PBCH Parameter Estimation
PBCH Channel Estimation
PBCH Decoding
[11]:
## N_ID_1 Estimation: SSS based
sssDetection   = SSSDetection(method="channelAssisted", nID2=rN_ID2)
rN_ID1         = sssDetection(ssbEstimate[0])
rN_ID          = 3*rN_ID1 + rN_ID2

## Generate SSB object to get DMRS and PBCH Indices
rxSSBobject    = SSB_Grid(rN_ID)
rxDMRSIndices  = rxSSBobject.dmrsIndices

## Generate DMRS sequence
dmrsLen        = 144
dmrsDetection  = DMRSParameterDetection(int(rN_ID), nssbCandidatesInHrf)
rssbIndex, rHrfBit = dmrsDetection(ssbEstimate[0])
rxDMRSobject   = DMRS("PBCH", int(rN_ID), int(rssbIndex), nssbCandidatesInHrf, rHrfBit)
rxDMRSseq      = rxDMRSobject(dmrsLen)

# ## Estimating the channel at DMRS (t-f) location, interpolting for data (t-f) location and equalizing the symbols
# ## Object for Channel Estimation
# chanEst        = ChannelEstimationAndEqualization(estimatorType = "ZF", interpolatorType = "NN")
# rxPBCHIndices  = rxSSBobject.pbchIndices
# pbchEstimate   = chanEst(ssbEstimate, rxDMRSseq, rxDMRSIndices, rxPBCHIndices, 10)

chanEst        = ChannelEstimationAndEqualizationPBCH(estimatorType = "ZF", interpolatorType = "Linear", isUEmobile=True)
pbchEstimate   = chanEst(ssbEstimate, rxDMRSseq, rN_ID)

## PBCH Chain for Decoding information
polarDecoder    = "SCL"
symbolDemapper  = "maxlog"
# extractMIBinfo = False
extractMIBinfo  = True
# carrierFreq, cellID, nssbCandidatesInHrf, ssbIndex, polarDecType, symbolDemapperType
pbchDecoder     = PBCHDecoder(center_frequency, int(rN_ID), nssbCandidatesInHrf, rssbIndex, polarDecoder, symbolDemapper)
rxMIB, check    = pbchDecoder(pbchEstimate, 10, extractMIBinfo)
<frozen toolkit5G.ChannelCoder.PolarCoder.polarDecoder>:494: UserWarning: Required ressource allocation is large for the selected blocklength. Consider option `cpu_only=True`.
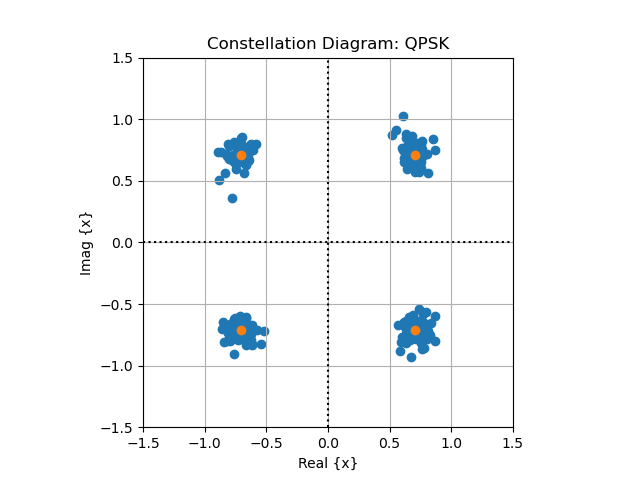
5.2 Constellation Diagram: User Equipment
[12]:
qpsk = np.array([1+1j, 1-1j, -1+1j, -1-1j])/np.sqrt(2)
fig, ax = plt.subplots()
ax.set_aspect(True)
ax.scatter(np.real(pbchEstimate), np.imag(pbchEstimate))
ax.scatter(np.real(qpsk), np.imag(qpsk), )
ax.grid()
ax.axhline(y=0, ls=":", c="k")
ax.axvline(x=0, ls=":", c="k")
ax.set_xlim([-1.5, 1.5])
ax.set_ylim([-1.5, 1.5])
ax.set_xlabel("Real {x}")
ax.set_ylabel("Imag {x}")
ax.set_title("Constellation Diagram: QPSK")
plt.show()
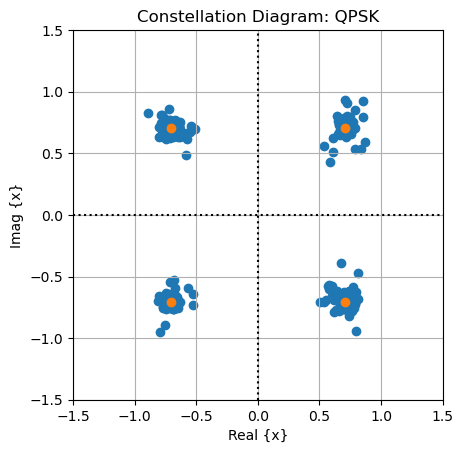
5.2 Error vector magnitude (EVM)
[13]:
evmV = np.min(np.abs(qpsk.reshape(-1,1) - pbchEstimate), axis=0)
evm = np.mean(evmV)

print("The error vector magnitude is  " +str(evm))
The error vector magnitude is 0.05997559306951416
5.2 Quasi-realtime: CFO Estimation and Reconstruction
Note: The following snippet of code only works with interactive maplotlib.
 Please ensure that you have intractive matplotlib installed on your system.
uncomment the ``%matplotlib widget`` in first code block for the following section of code to work
[14]:
# # function that draws each frame of the animation
# def animate(i):
#     # Receive samples
#     rx_samples = sdr.rx()

#     pssPeakIndices, pssCorrelation, rN_ID2, freqOffset = pssDetection(rx_samples, fftSize, lengthCP = lengthCP[1],
#                                                                   nID2=None, freqOffset = ssboffset)

#     if(pssPeakIndices < 3*(fftSize + lengthCP[1])):
#         pssPeakIndices = pssPeakIndices + 14*(fftSize + lengthCP[1])
#     elif(pssPeakIndices > rx_samples.size - 13*(fftSize + lengthCP[1])):
#         pssPeakIndices = pssPeakIndices - 14*(fftSize + lengthCP[1])

#     # CFO estimation
#     obj    = CarrierFrequencyOffsetEstimation(fftSize,lengthCP[1])
#     cfoEst = obj(rx_samples[pssPeakIndices: pssPeakIndices + numSamples],numCFOIteration = 2)  # Computed CFO

#     ## OFDM Demodulator Object
#     ofdmDemodulator = OFDMDemodulator(fftSize, lengthCP[1])
#     pssStartIndex   = pssPeakIndices

#     # With CFO correction
#     cfo             = cfoEst
#     rxGrid          = ofdmDemodulator(((np.exp(-1j*cfoEst*indices/fftSize)*rx_samples).reshape(1,-1))[...,pssStartIndex:(pssStartIndex+4*(fftSize+lengthCP[1]))])
#     ssbEstimate     = rxGrid[:,:,ssboffset:(ssboffset+240)]

#     chanEst        = ChannelEstimationAndEqualizationPBCH(estimatorType = "ZF", interpolatorType = "Linear", isUEmobile=True)
#     pbchEstimate   = chanEst(ssbEstimate, rxDMRSseq, rN_ID)

#     ## PBCH Chain for Decoding information
#     # carrierFreq, cellID, nssbCandidatesInHrf, ssbIndex, polarDecType, symbolDemapperType
#     pbchDecoder     = PBCHDecoder(center_frequency, int(rN_ID), nssbCandidatesInHrf, rssbIndex, polarDecoder, symbolDemapper)
#     rxMIB, check    = pbchDecoder(pbchEstimate, 10, extractMIBinfo)

#     ax.clear()
#     ax.set_xlim([-1.5, 1.5])
#     ax.set_ylim([-1.5, 1.5])
#     ax.scatter(np.real(pbchEstimate), np.imag(pbchEstimate))
#     ax.scatter(np.real(qpsk), np.imag(qpsk), )
#     ax.grid()
#     ax.axhline(y=0, ls=":", c="k")
#     ax.axvline(x=0, ls=":", c="k")
#     ax.set_xlabel("Real {x}")
#     ax.set_ylabel("Imag {x}")
#     ax.set_title("Constellation Diagram: QPSK")

# # Plot SSB
# fig, ax = plt.subplots()
# ax.set_aspect(True)

# scale = 100
# #####################
# # run the animation
# #####################
# # frames= 20 means 20 times the animation function is called.
# # interval=500 means 500 milliseconds between each frame.
# # repeat=False means that after all the frames are drawn, the animation will not repeat.
# # Note: plt.show() line is always called after the FuncAnimation line.


# anim = animation.FuncAnimation(fig, animate, frames=1000, interval=1, repeat=False, blit=True)
# # saving to mp4 using ffmpeg writer
# plt.show()

# anim.save("CFO_Estimation_RT2.gif", fps = 10)

# # writervideo = animation.FFMpegWriter(fps=60)
# # anim.save('Overall.mp4', writer=writervideo)
[ ]: